
Interactive resource
Brain Atlas
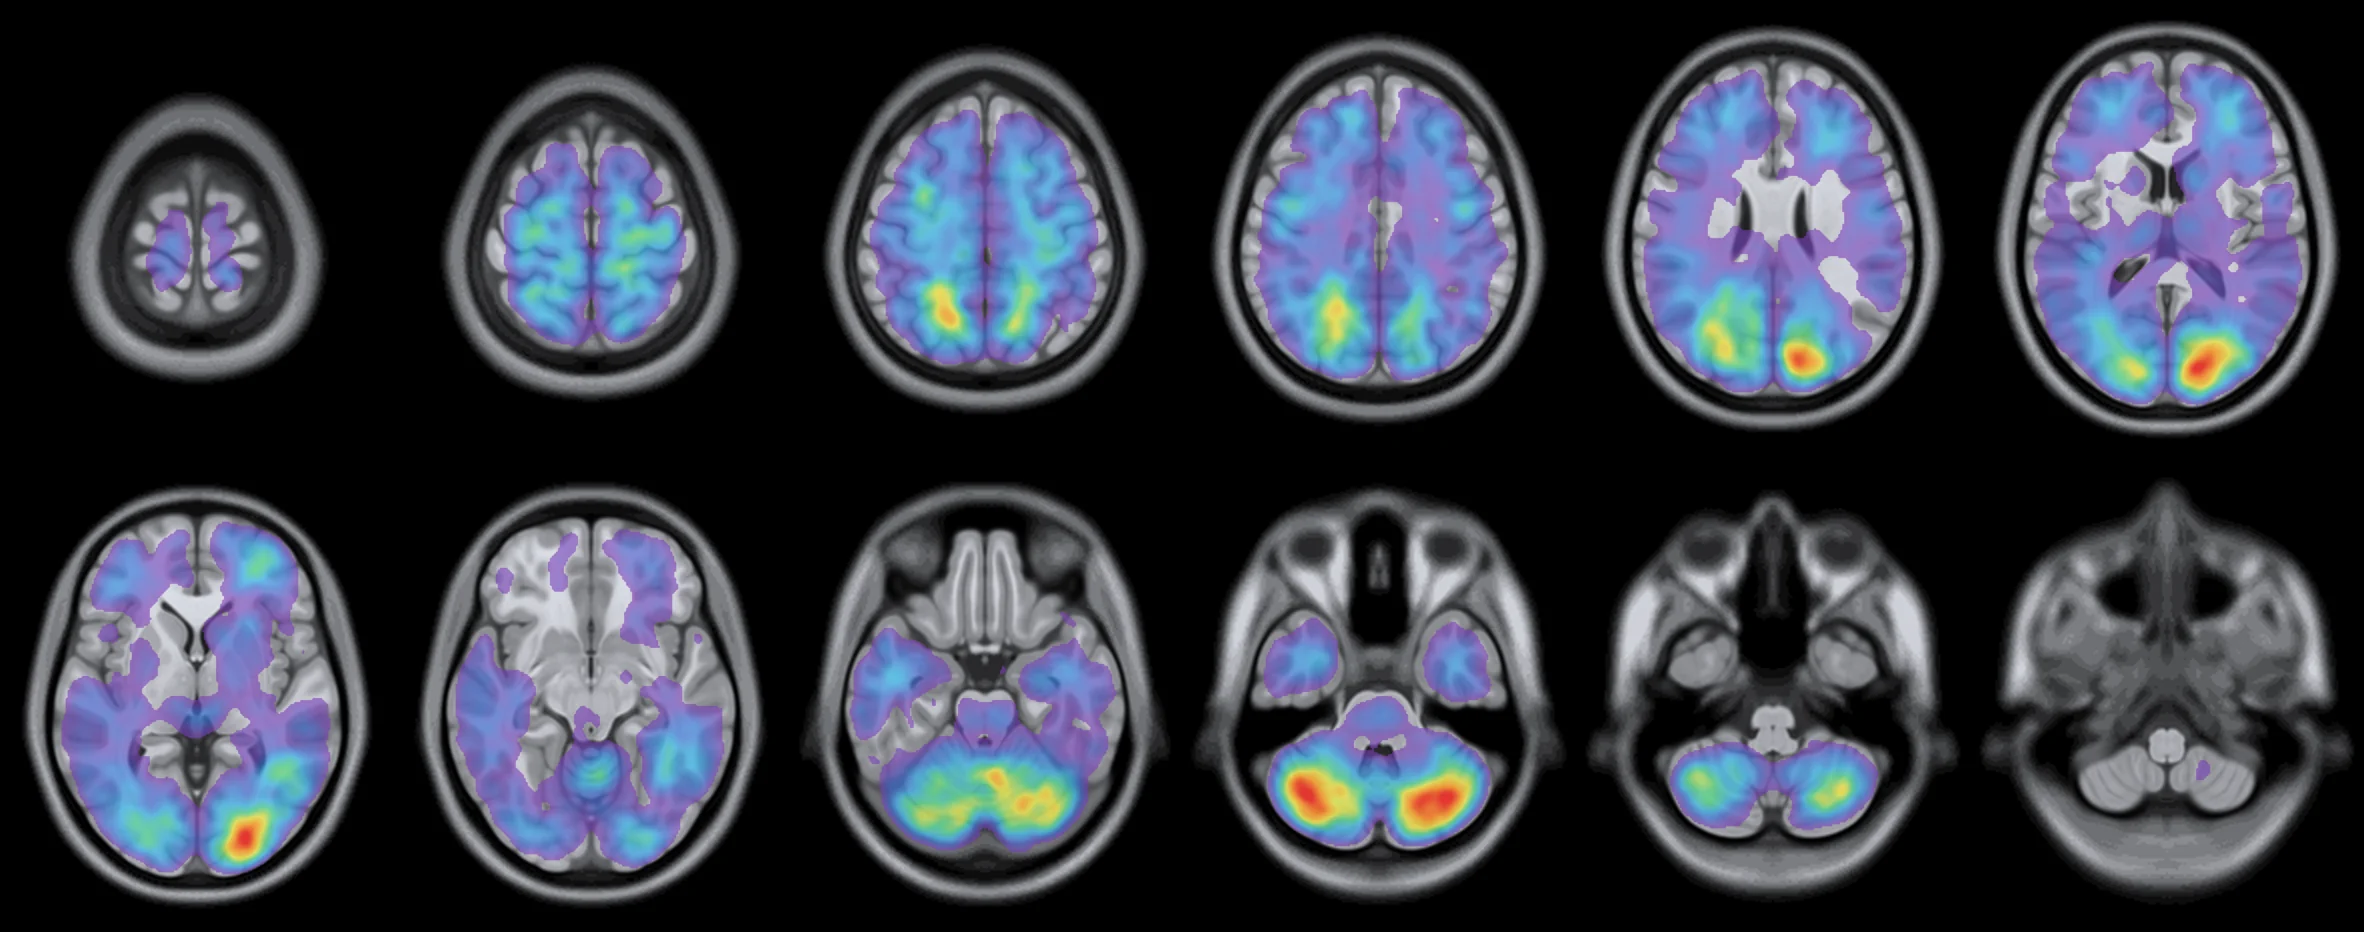
Where 13,926 brain metastases in 3,290 patients from 4 institutions were found, on the MNI152 brain at 1 mm. Population frequencies, not individual predictions. This update is not yet published; the published atlas and its findings are on the Brain Metastases page.
Update 2026.03 · unpublished
Highest relative frequency
Shown only where at least 5 lesions contribute; regions with fewer than 5 lesions are withheld. 1× is the frequency expected if metastases were spread evenly through the brain; for a region, its share of lesions divided by its share of brain volume, with 95% confidence intervals. Radiological convention: the patient's right is on the left. Full-resolution maps are available on request: Olivier.Morin@ucsf.edu.
Compare
Primary cancers on one scale
The coarse anatomical atlas, each region colored by its share of lesions relative to its share of brain volume, from 0× to 2× and above. Gray regions have fewer than five lesions. Drag an image to turn it.
Reference atlases
Four ways to divide the brain
References
- Barrios J, Porter E, Capaldi DPI, et al. Multi-institutional atlas of brain metastases informs spatial modeling for precision imaging and personalized therapy. Nat Commun. 2025;16:4536. doi:10.1038/s41467-025-59584-7
- Morin O, Vallières M, Braunstein S, et al. An artificial intelligence framework integrating longitudinal electronic health records with real-world data enables continuous pan-cancer prognostication. Nat Cancer. 2021;2(7):709-722. PMID 35121948